The Histogram
The histogram is a completely basic tool that only shows us the changes we make to the photo using any other basic tool of the program.
We do not manipulate it per se, we only use it to see what we are doing with the photo.
It is actually a graph showing on its horizontal axis the values of the gray levels and on the vertical the number of pixels present in each value.
The horizontal values start from zero corresponding to black and reach 255 corresponding to white. Theoretically the average gray is at 127.
Here is a full gradient, starting from 0 and going all the way up to 255 (the 256 levels of gray).
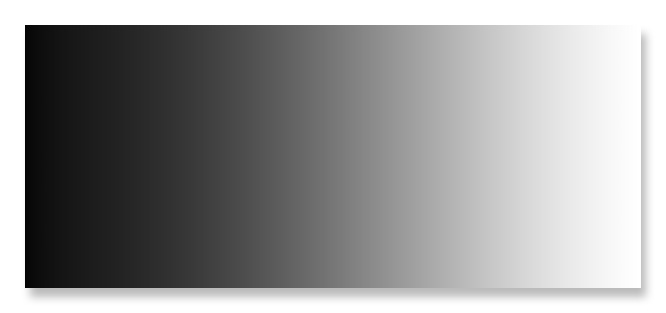
In the image below we see a typical histogram of this gradient.
As we see here, in all values there is the same number of pixels. So, we have a completely equal histogram.
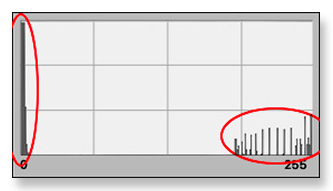
In the second image we have an histogram that has much more pixels in the dark area, in the shadows, as we say, than it has in the rest of the image.
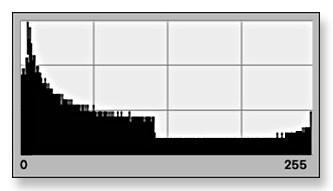
This may indicate that we have a photo that is underexposed, or it may be a photo that we would like it to have lots of pixels in the shadows part. The concentration of values on the one or the other side of a histogram of a picture does not necessarily mean that this picture it is a not correct one !
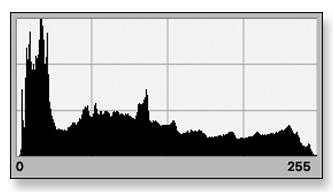
Here for example is a photo of the moon.
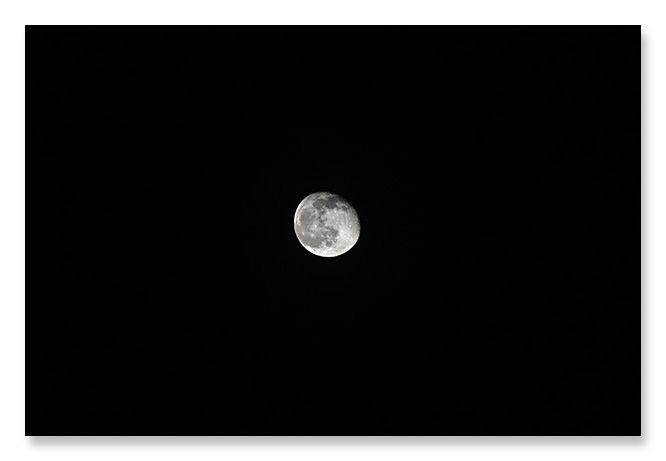
In this photo we have a very large zone of black and in the middle the very bright moon itself. We have a very high concentration of shadow values on the histogram, but that does not mean that our photo is underexposed.
On the left, the huge number of dark pixels in the photo and on the right, some light values, the highlights as we call them, values that correspond to the brightness of the Moon.
It is important to understand how the histogram works and how every time we translate what it tells us in its 'language'.
The Histogram Parts
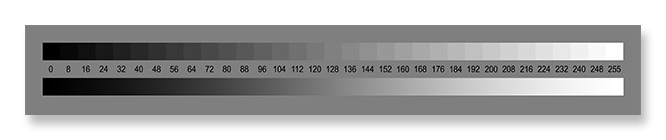
In the Electronic Photography the values of the tones of a photograph are expressed in a scale going from zero to 255. We say that we have 256 levels. For a Gray Scale photograph, there are 256 levels, Black (0), 254 Grays and White (255). Most of photo editing programs use this scale in their editing tools.
See here a gradient from zero to 255, first in steps of 8, and below a full one. These are the values that are represented on the histogram.
We usually see the histogram in parts. These parts describe, in groups, the values of the tones of a photograph. And this is a usage that comes from the classic film photography. There are not clearly defined limits between these parts, we just use them as a way to understand each other.
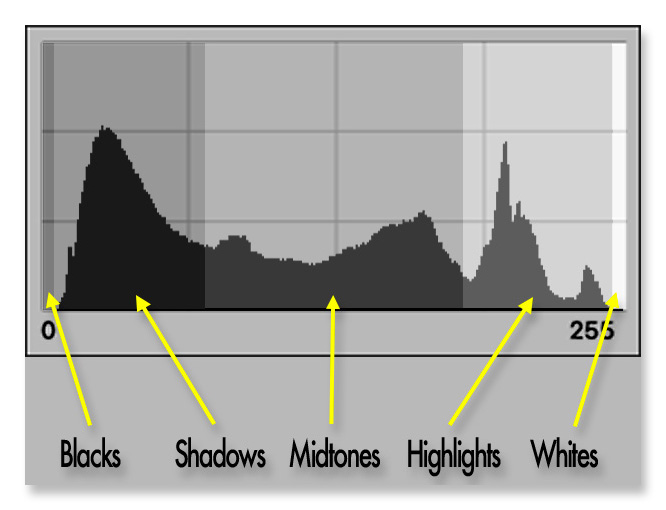
The Blacks. They are the 'bottom' of the tones of a photo, values close to zero, and zero itself. We say 'this photo has no blacks'. Or 'I must raise the blacks a little for the printing'.
The Shadows. All these tones that are not black but still difficult to the eye to distinguish. It is important to try not to lose detail in the shadows, that means not to mix the levels of gray, just because the eye has a hard time to see differences in the dark.
The midtones. Here is where all the exposure is based. Usually we put the most important part of a photo in the midtones. The key here is that 'usually' !
The Highlights. The most dangerous part. Burn the highlights, burn is the term here, and you lose a big part of the image. Nowadays, the cameras can hold very big differences in light but it is still easy to overexpose the image and have no way to recover any lost detail.
The Whites. Well, not much here except that usually we consider as the whites of the image the paper base itself. Here is where the most light details of the image, the highlights, must not fall.
Histogram and Color Images
In its most common use, we use the histogram to see the general brightness of a photograph. Since Gray Scale photos have only one channel, everything is simple. Histogram equals brightness.
Color photos on the other hand have three channels. The Red, the Green and the Blue. In this case we can also use the Histogram to see the brightness of each color channel separately.
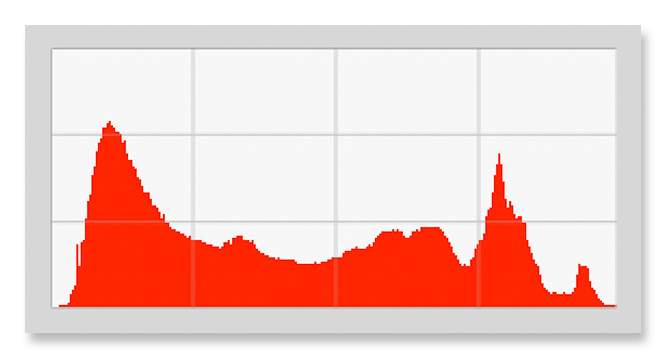
The Red Channel
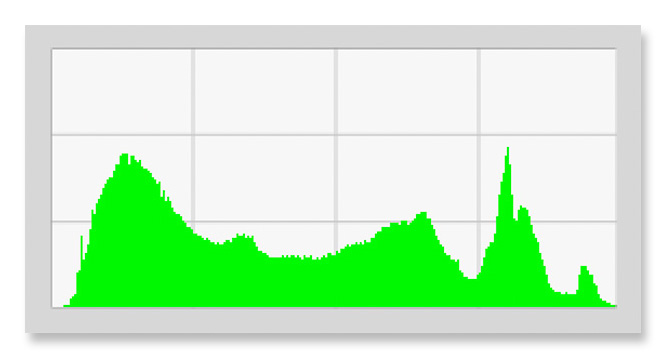
The Green Channel
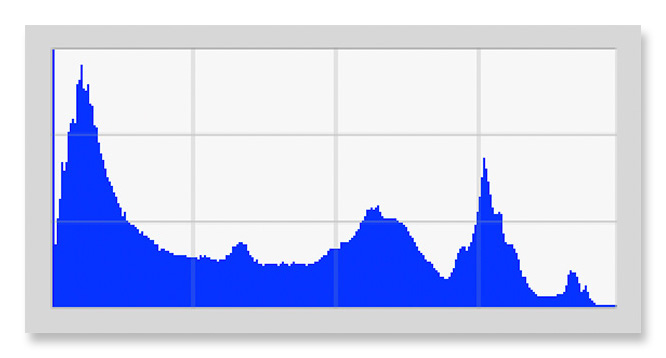
The Blue Channel
Or even of all three channels at the same time.
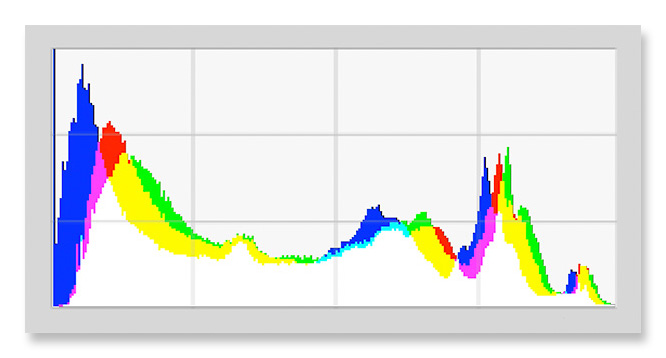
Notice here the mixing of the three channels. Since we are in the additive mode, red and green give yellow, green and blue give cyan, blue and red give magenta and finally all three together give white.
The Histogram of various Programs
There are many photo editing programs and they all have their own style of showing the Histogram. I present here some of them and their particularities.
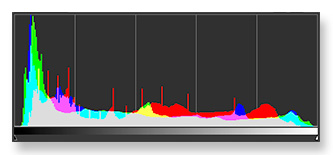
Photoshop
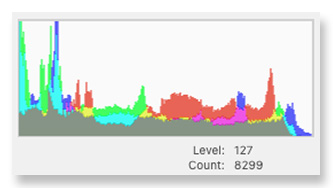
And first of all Photoshop. The colors separately or all three together (grey). Below we have an indication of how many pixels are at each level of the range.
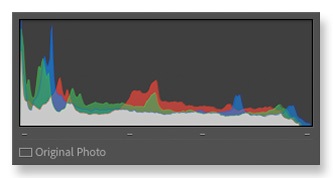
Affinity Photo
In a relatively small Histogram Affinity Photo shows the three colors together or separately. It also has an indication of how many pixels there are at each level of the colors of the photo, just like photoshop.
Darktable
Darktable also has a relatively simple Histogram. It shows the three colors separately but also their composition in white.
DXO Photolab
Again the Histogram is presented in the same way. It's quite practical that it shows us the values right below so we don't have to search from one window to another.
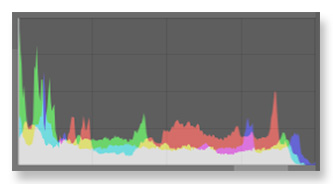
GIMP
The Gimp. Again a classic way to visualize the Histogram. A particular characteristic is that just below it gives us a complete gradient so that we can have an idea of to what brightnesses of the photo every part corresponds to.
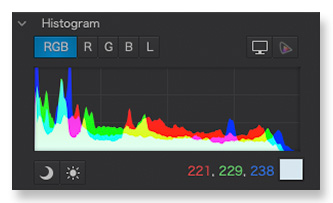
Lightroom
Another classic Histogram. The three colors and their mixing.
Lightzone
The three colors and below a series of tones again to know approximately where each point of the photo is.
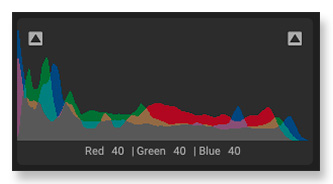
Luminar Neo
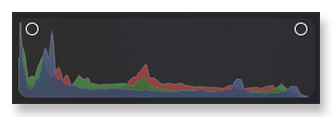
A completely simple Histogram, almost no information except for two buttons at the two ends that, pressing them, give us on the photo itself, what has been cut from the black or the white part of it.
ON1 Photo Raw
Practical that it also gives the color values for each point of the photo directly below. And once again, two buttons to show us the colors that are outside of the limits of the photo.
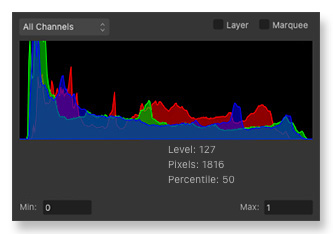
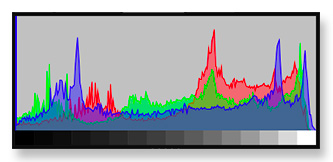
Raw Therapy
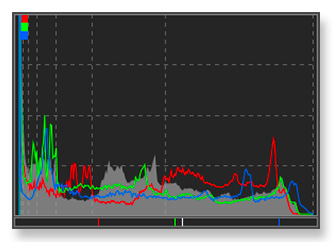
A very nice Histogram, maybe, for me, the best. The three colors appear as a thin line and their composition in the background. It is also very practical that below it gives us the positioning of the pixel we have selected in the photo, for each color separately as well as the general brightness.
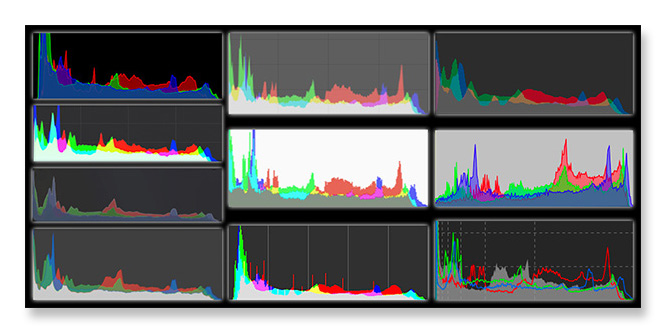
Something to note is that, although here, all the programs display the Histogram of the exact same photo they have some differences between them. That means that some if not all of them do not illustrate the values of the photo very faithfully. This is a good reason why we should take the Histogram as just an indication and not as an absolute value.